Example 2.2 from Experimental Design and Analysis for Tree Improvement
Source:R/Exam2.2.R
Exam2.2.RdExam2.2 is used to compare two seed lots by using ANOVA under RCB Design.
References
E.R. Williams, C.E. Harwood and A.C. Matheson (2023). Experimental Design and Analysis for Tree Improvement. CSIRO Publishing (https://www.publish.csiro.au/book/3145/).
See also
Examples
library(car)
library(dae)
library(dplyr)
library(emmeans)
library(ggplot2)
library(lmerTest)
library(magrittr)
library(predictmeans)
library(supernova)
data(DataExam2.2)
# Pg. 24
fmtab2.5 <- lm(formula = dbh ~ Blk + SeedLot, data = DataExam2.2)
# Pg. 26
anova(fmtab2.5)
#> Analysis of Variance Table
#>
#> Response: dbh
#> Df Sum Sq Mean Sq F value Pr(>F)
#> Blk 7 48.867 6.9810 3.8959 0.04671 *
#> SeedLot 1 14.270 14.2695 7.9635 0.02570 *
#> Residuals 7 12.543 1.7919
#> ---
#> Signif. codes: 0 '***' 0.001 '**' 0.01 '*' 0.05 '.' 0.1 ' ' 1
supernova(fmtab2.5, type = 1)
#> Analysis of Variance Table (Type I SS)
#> Model: dbh ~ Blk + SeedLot
#>
#> SS df MS F PRE p
#> ------- --------------- | ------ -- ------ ----- ----- -----
#> Model (error reduced) | 63.136 8 7.892 4.404 .8343 .0330
#> Blk | 48.867 7 6.981 3.896 .7957 .0467
#> SeedLot | 14.270 1 14.270 7.964 .5322 .0257
#> Error (from model) | 12.543 7 1.792
#> ------- --------------- | ------ -- ------ ----- ----- -----
#> Total (empty model) | 75.679 15 5.045
# Pg. 26
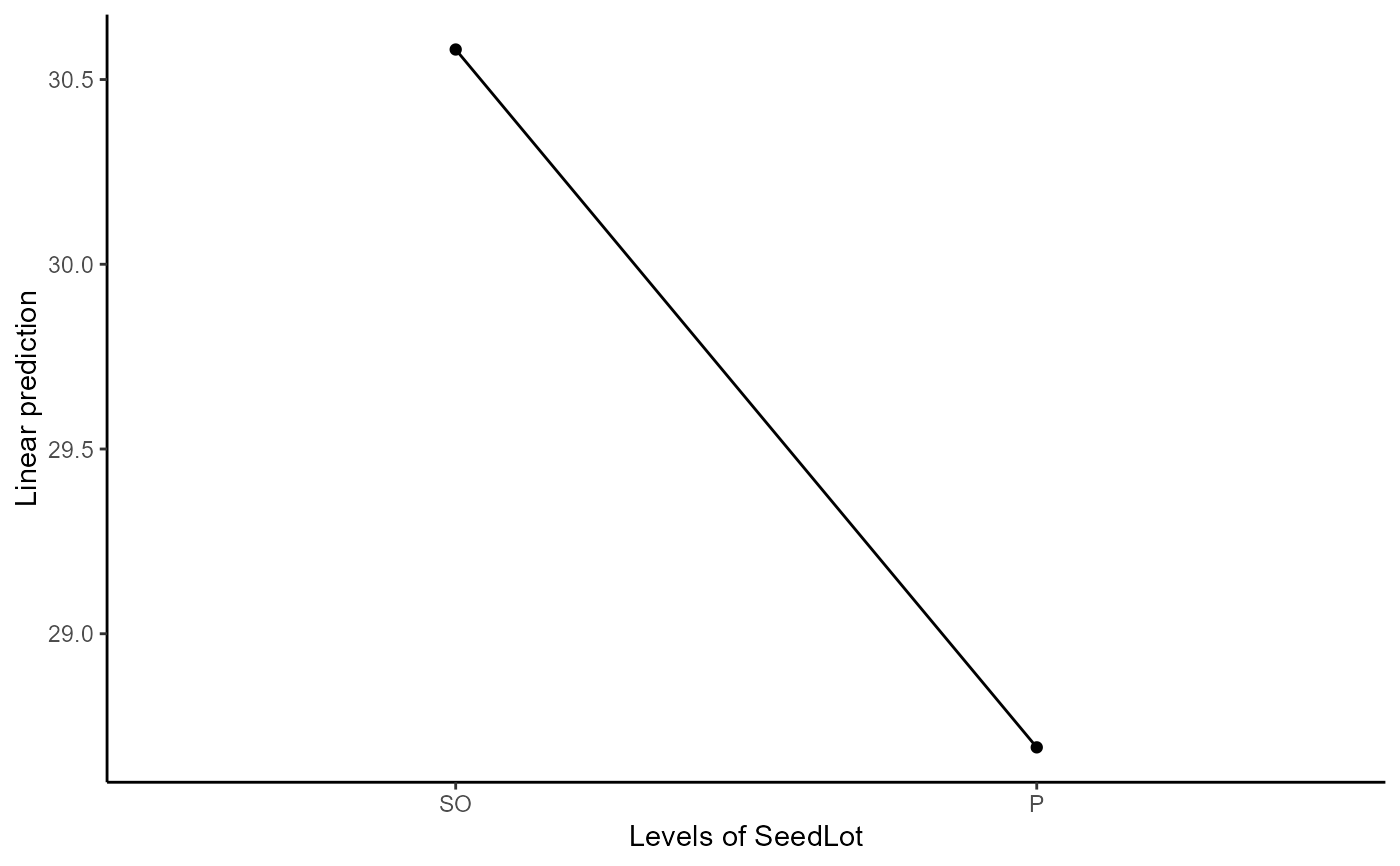
emmeans(object = fmtab2.5, specs = ~ SeedLot)
#> SeedLot emmean SE df lower.CL upper.CL
#> SO 30.6 0.473 7 29.5 31.7
#> P 28.7 0.473 7 27.6 29.8
#>
#> Results are averaged over the levels of: Blk
#> Confidence level used: 0.95
emmip(object = fmtab2.5, formula = ~ SeedLot) +
theme_classic()